Basics of Trading

Trading Series I Education Hub

Trading Basics thumbnail

The term trading is simply referred to as buying and selling securities to make money on daily price changes. If you want to trade in the share market, you should have a good grasp of the fundamentals of share trading.

Learning Tip

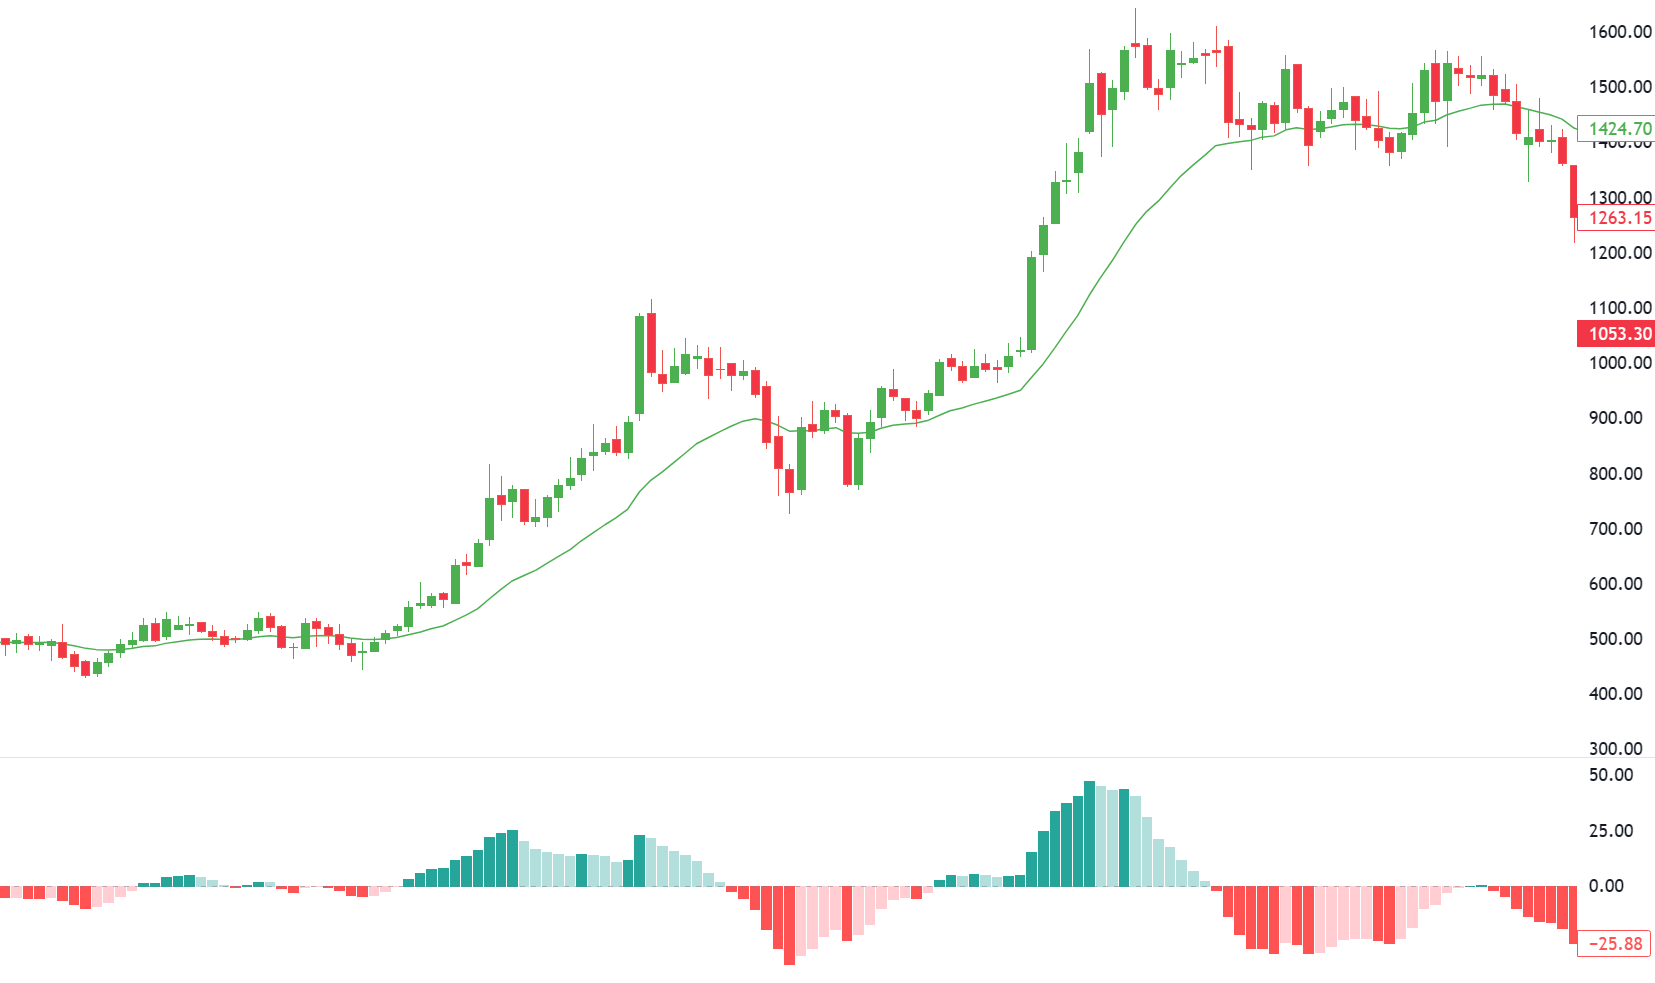
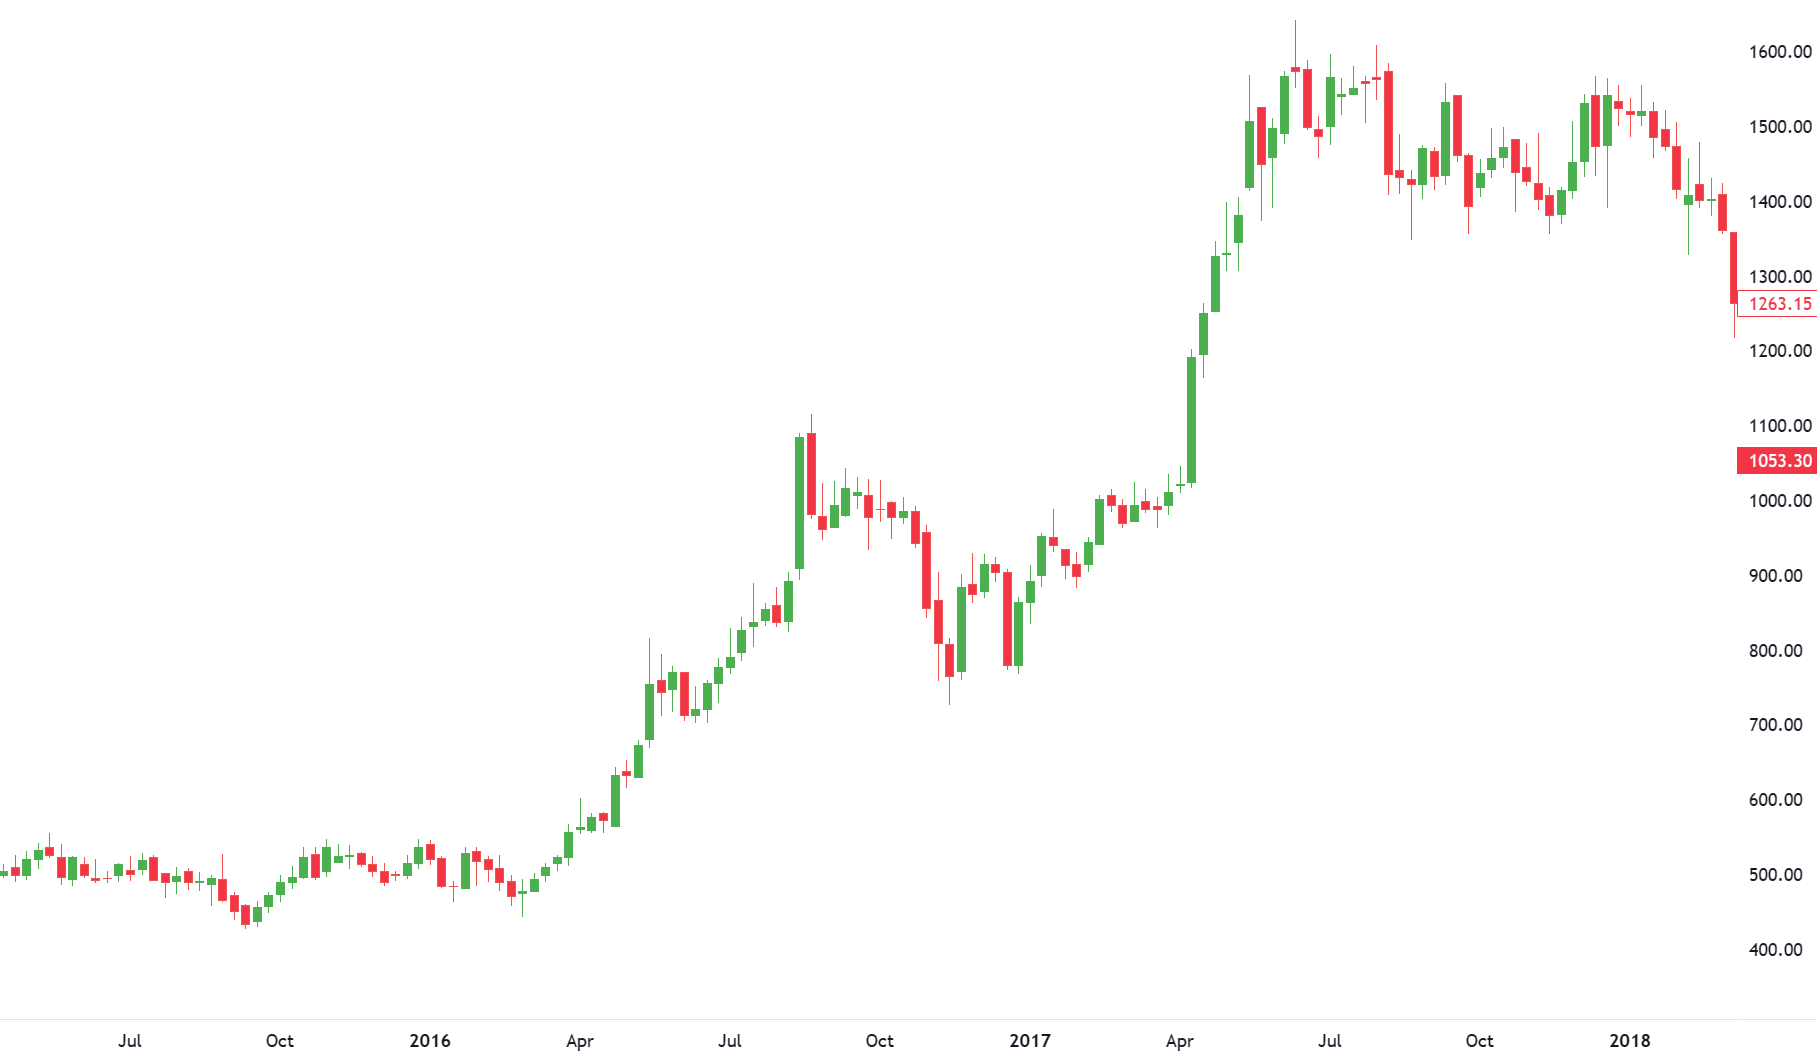
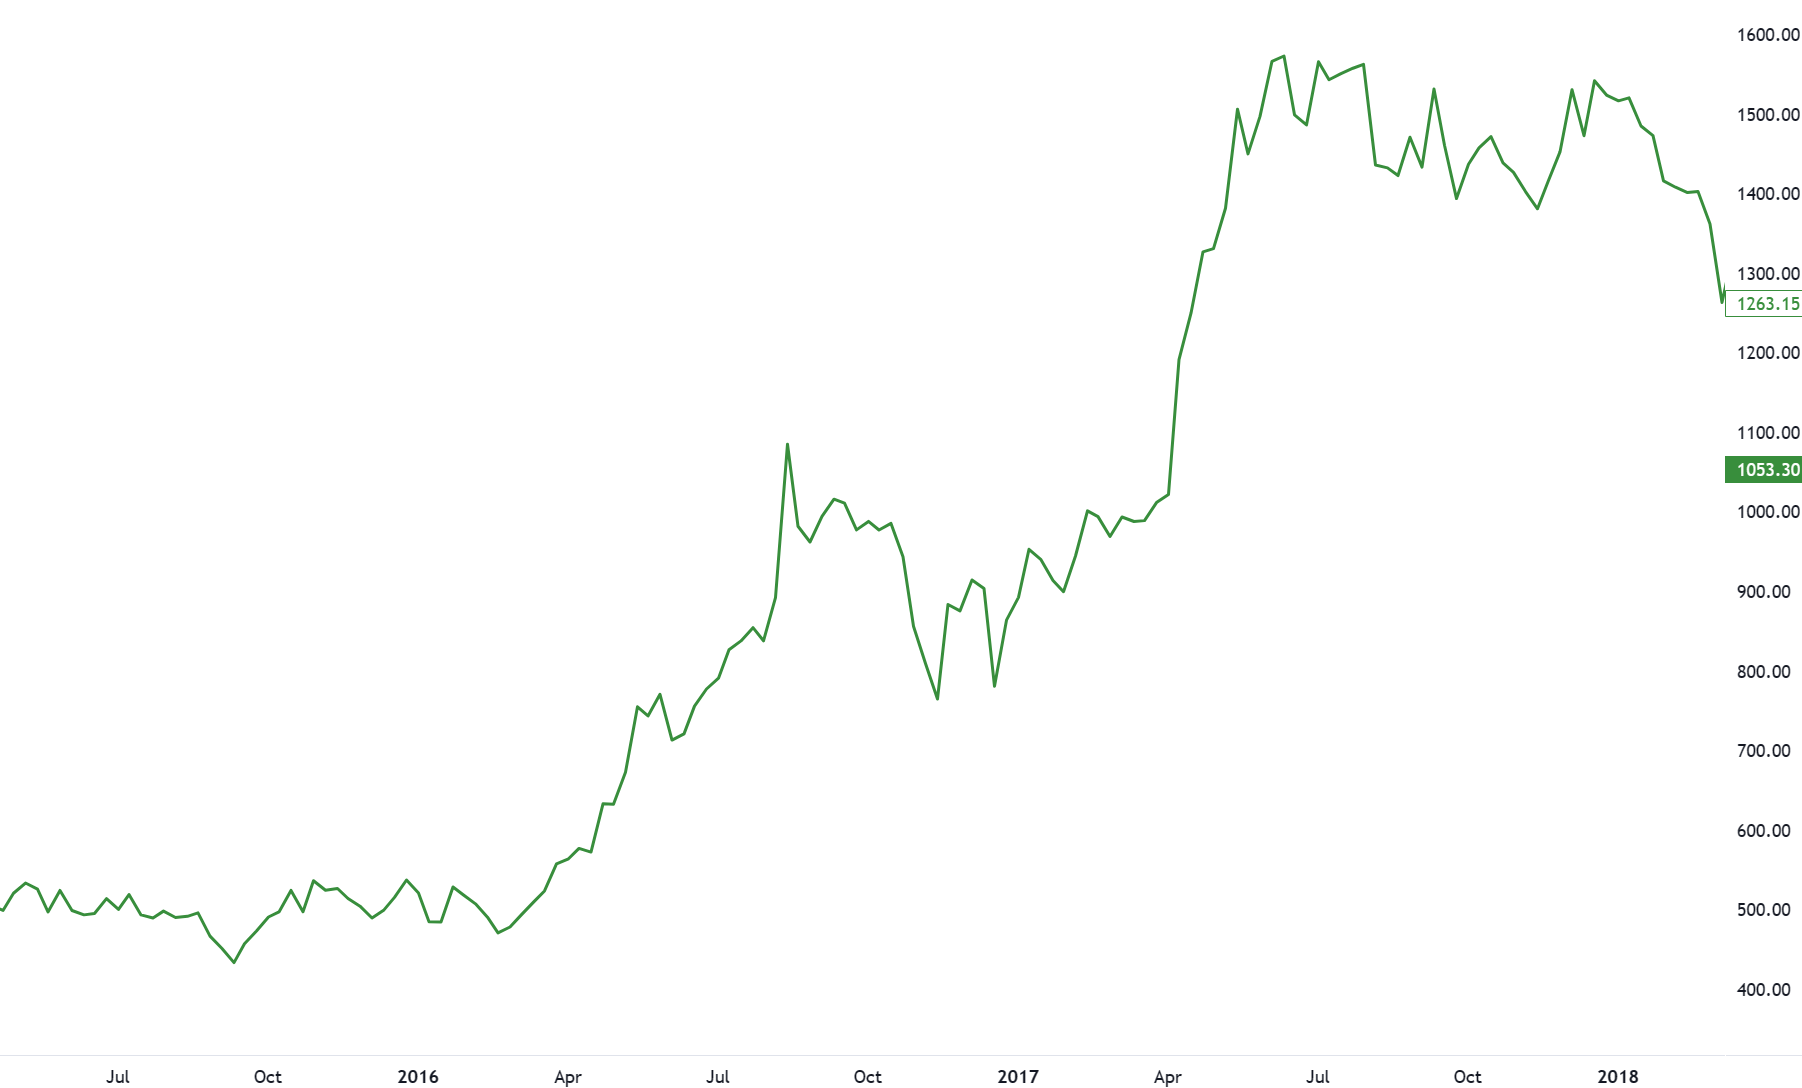
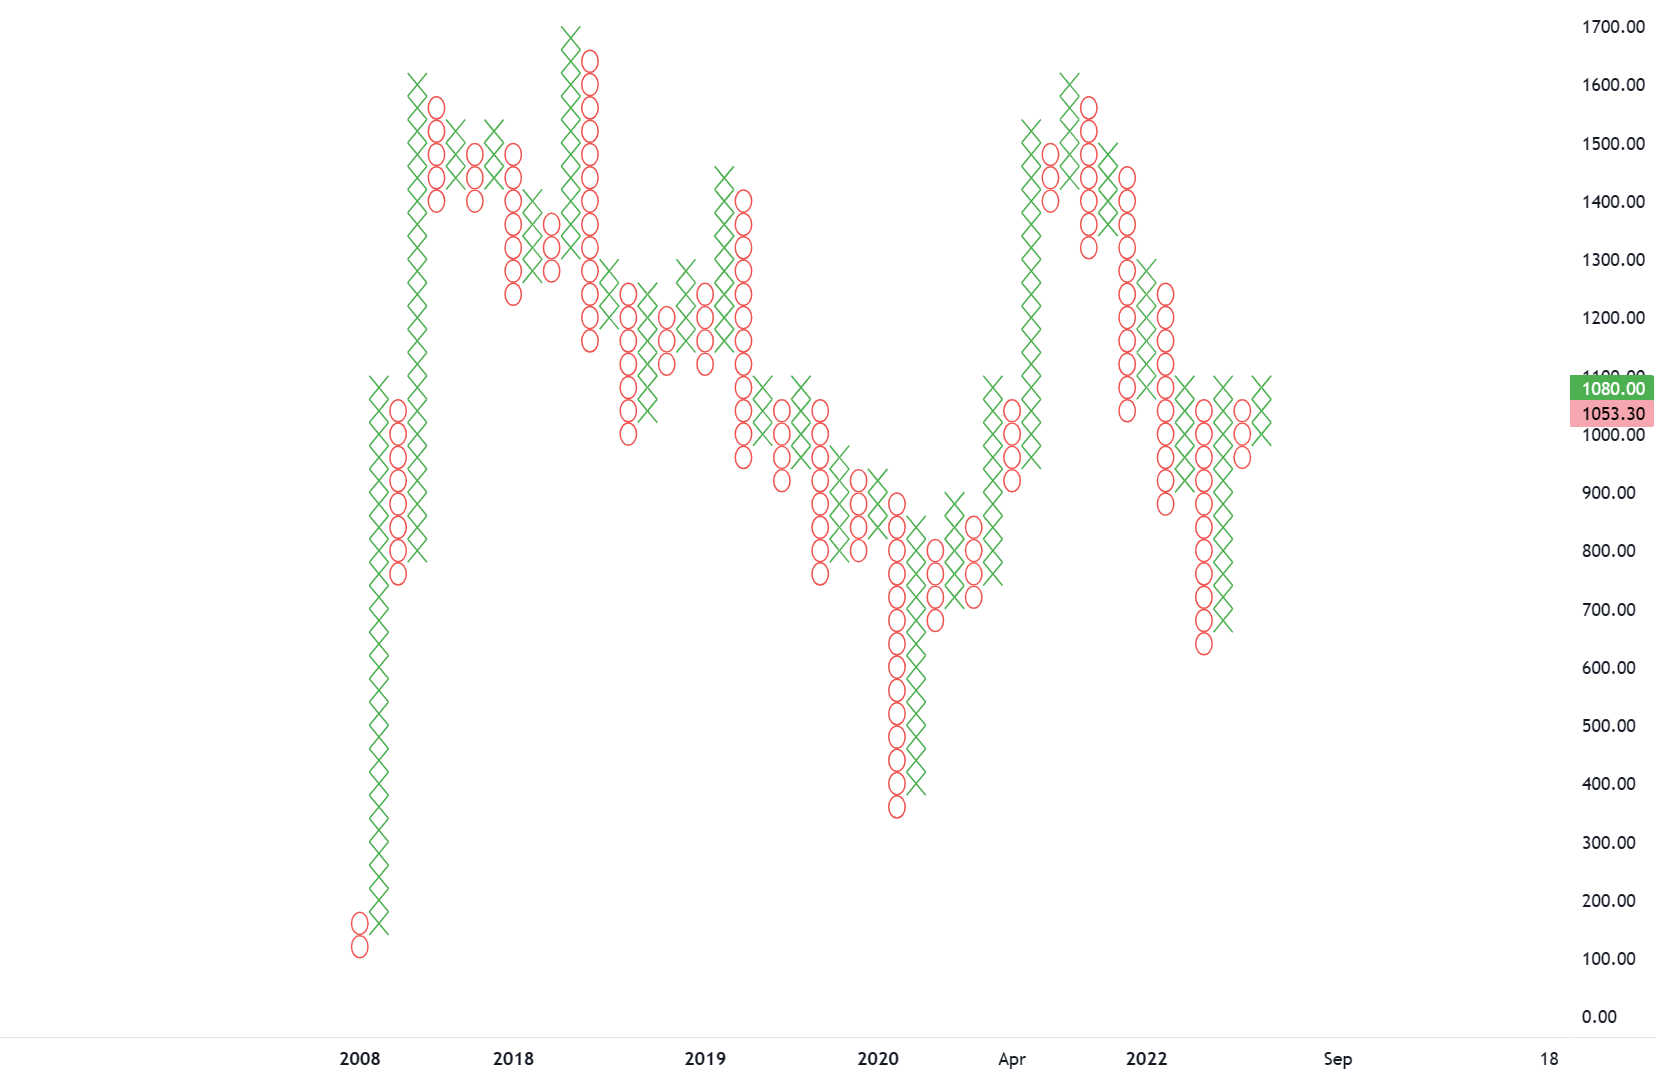
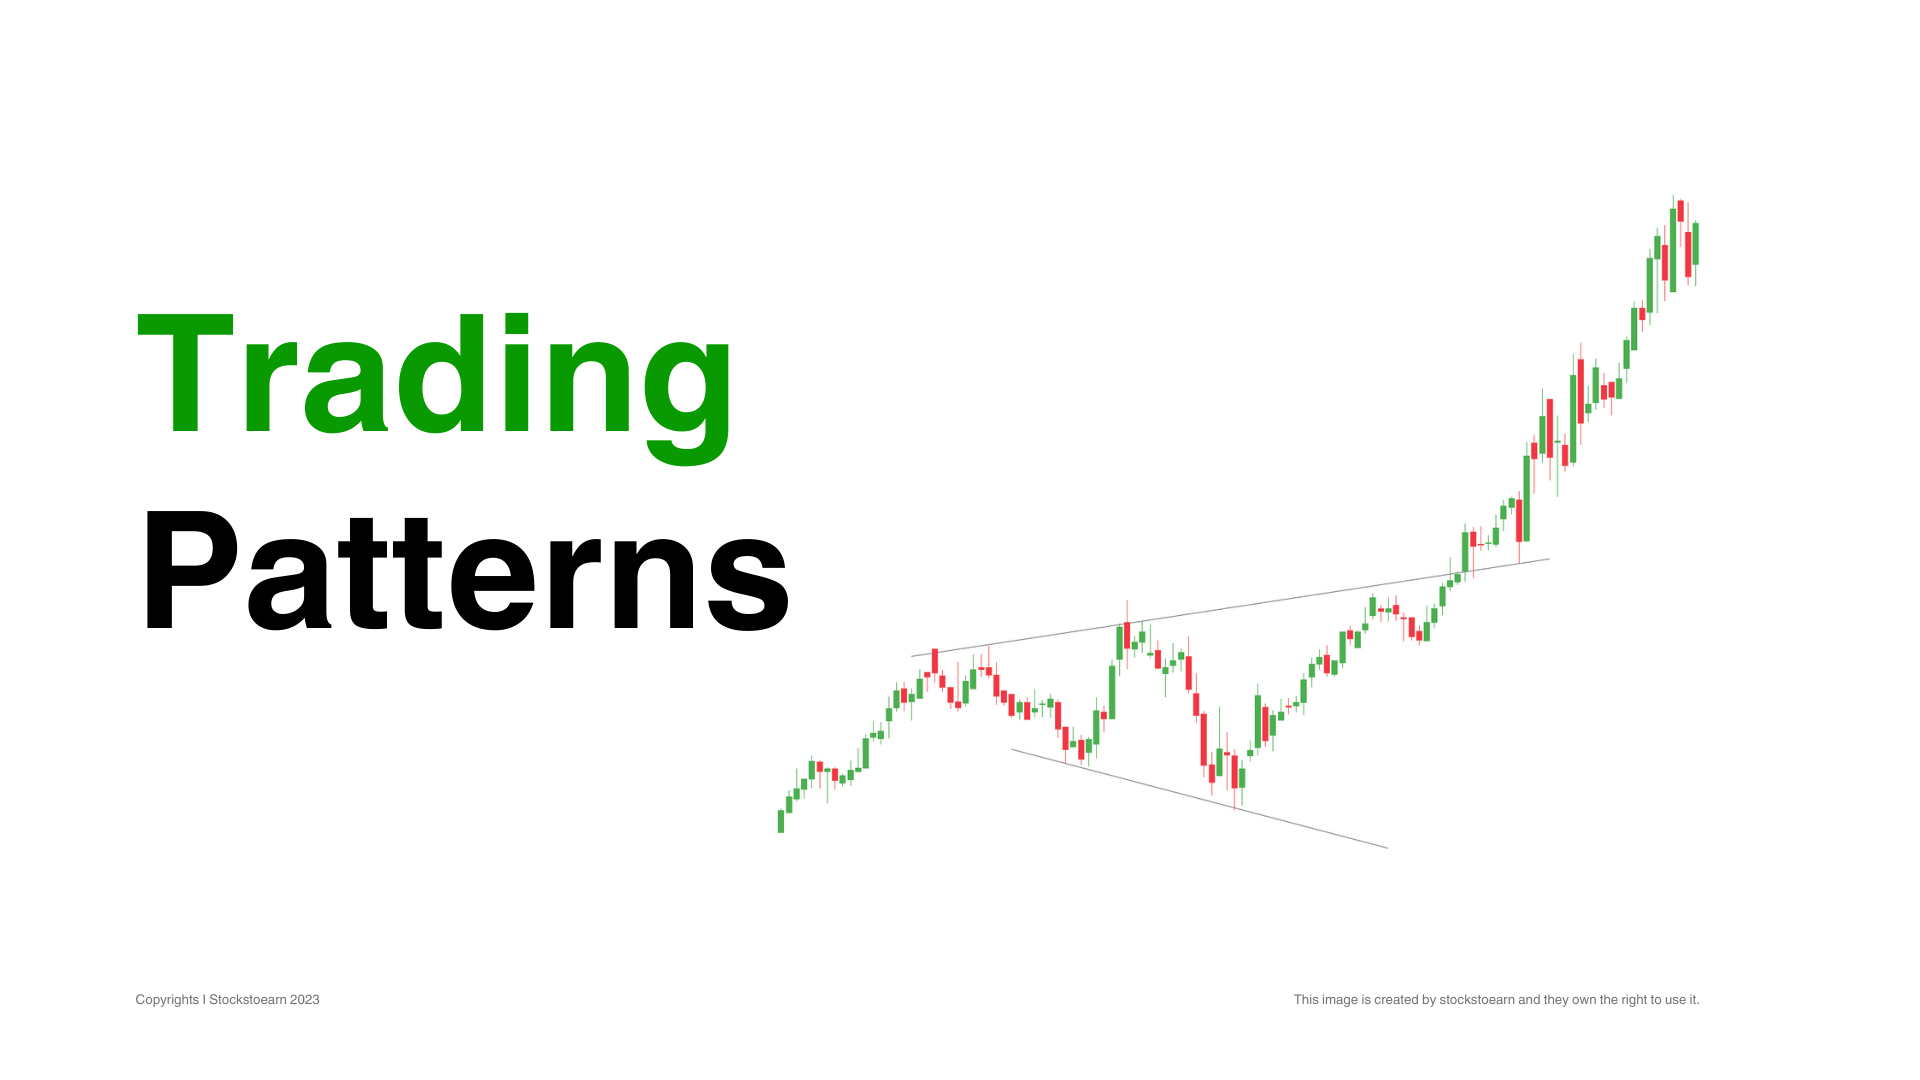
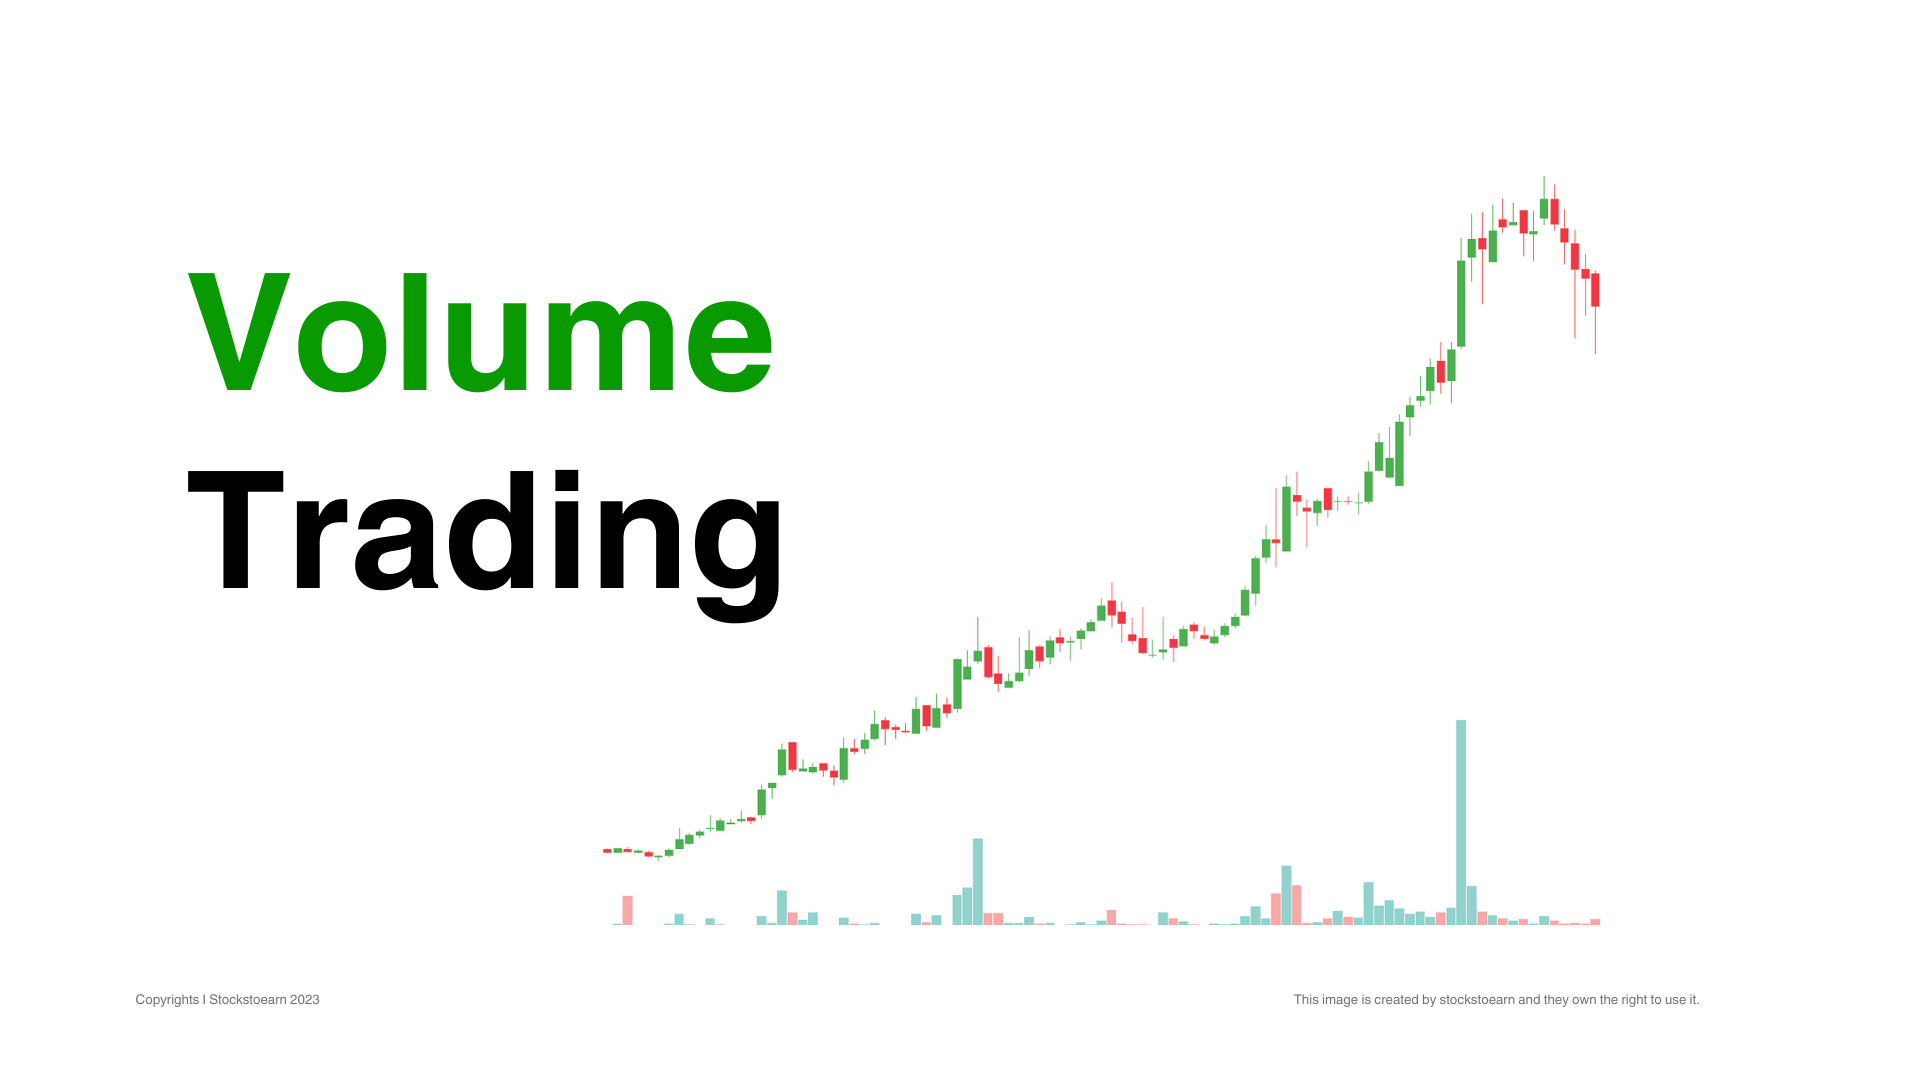
To learn trading, you need to learn about technical indicators and charts. There are two types of analysis you need to learn namely fundamental analysis and technical analysis. After learning these things, you need to practice and learn various strategies and models of trading.

Understanding

Technical Indicators

Technical Indicators

Technical Indicators are the often squiggly lines found above, below and on-top-of the price information on a technical chart. A technical indicator is a series of data points that are derived by applying a formula to the price data of a security.

A technical indicator offers a different perspective from which to analyze the price action. Some, such as moving averages, are derived from simple formulas and the mechanics are relatively easy to understand. Others, such as Stochastics, have complex formulas and require more study to fully understand and appreciate. Regardless of the complexity of the formula, technical indicators can provide a unique perspective on the strength and direction of the underlying price action. 

Indicators

Why Use Indicators?

Indicators serve three broad functions: to alert, to confirm and to predict. An indicator can act as an alert to study price action a little more closely. If momentum is waning, it may be a signal to watch for a break of support. Alternatively, if there is a large positive divergence building, it may serve as an alert to watch for a resistance breakout. Indicators can be used to confirm other technical analysis tools.

 If there is a breakout on the price chart, a corresponding moving average crossover could serve to confirm the breakout. If a stock breaks support, a corresponding low in the On-Balance-Volume (OBV) could serve to confirm the weakness. According to some investors and traders, indicators can be used to predict the direction of future prices.

Introduction

Trading Price Charts

price chart is a sequence of prices plotted over a specific timeframe. In statistical terms, charts are referred to as time series plots. On the chart, the y-axis (vertical axis) represents the price scale and the x-axis (horizontal axis) represents the time scale. Prices are plotted from left to right across the x-axis, with the most recent plot being the furthest right.

Trading Price Chart

Technical analysts and chartists use charts to analyze a wide array of securities and forecast future price movements. The word “security” refers to any tradable financial instrument or quantifiable index such as stocks, bonds, commodities, futures or market indices. Any security with price data over a period of time can be used to form a chart for analysis. 

Classification

Types of Charts

We will be explaining the construction of line, bar, candlestick and point & figure charts. Although there are other methods available, these are four of the most popular methods for displaying price data.

Line Chart

Line Chart: Some investors and traders consider the closing level to be more important than the open, high or low. By paying attention to only the close, intraday swings can be ignored. Line charts are also used when open, high and low data points are not available. Sometimes only closing data are available for certain indices, thinly-traded stocks, and intraday prices.

Bar Chart: Perhaps the most popular charting method is the bar chart. The high, low and close are required to form the price plot for each period of a bar chart. The high and low are represented by the top and bottom of the vertical bar while the open price is displayed as a short horizontal line extending to the left of the bar and close price is displayed as a short horizontal line extending to the right of the bar.

Trading Price Chart

Candlestick Chart: Originating in Japan over 300 years ago, candlestick charts have become quite popular in recent years. For a candlestick chart, the open, high, low and close are all required. Many traders and investors believe that candlestick charts are easy to read, especially the relationship between the open and the close.

point and figure chart

Point and Figure Chart: Contrary to all other charting methodology, point & figure charts are based solely on price movement, and do not take time into consideration. There is an x-axis, but it does not extend evenly across the chart. Little or no price movement is deemed irrelevant and therefore not duplicated on the chart. Only price movements that exceed specified levels are recorded. This focus on price movement makes it easier to identify support and resistance levels, bullish breakouts and bearish breakdowns.

Get PRO

Get access to exclusive premium features and benefits. Subscribe a PRO plan.

Related Topics