Trading Chart Patterns

Trading Series I Education Hub

Chart patterns provide a visual representation of the battle between buyers and sellers so you see if a market is trending higher, lower, or moving sideways. A good understanding of chart patterns will help you in making buy and sell decisions effectively.

Learning Tip

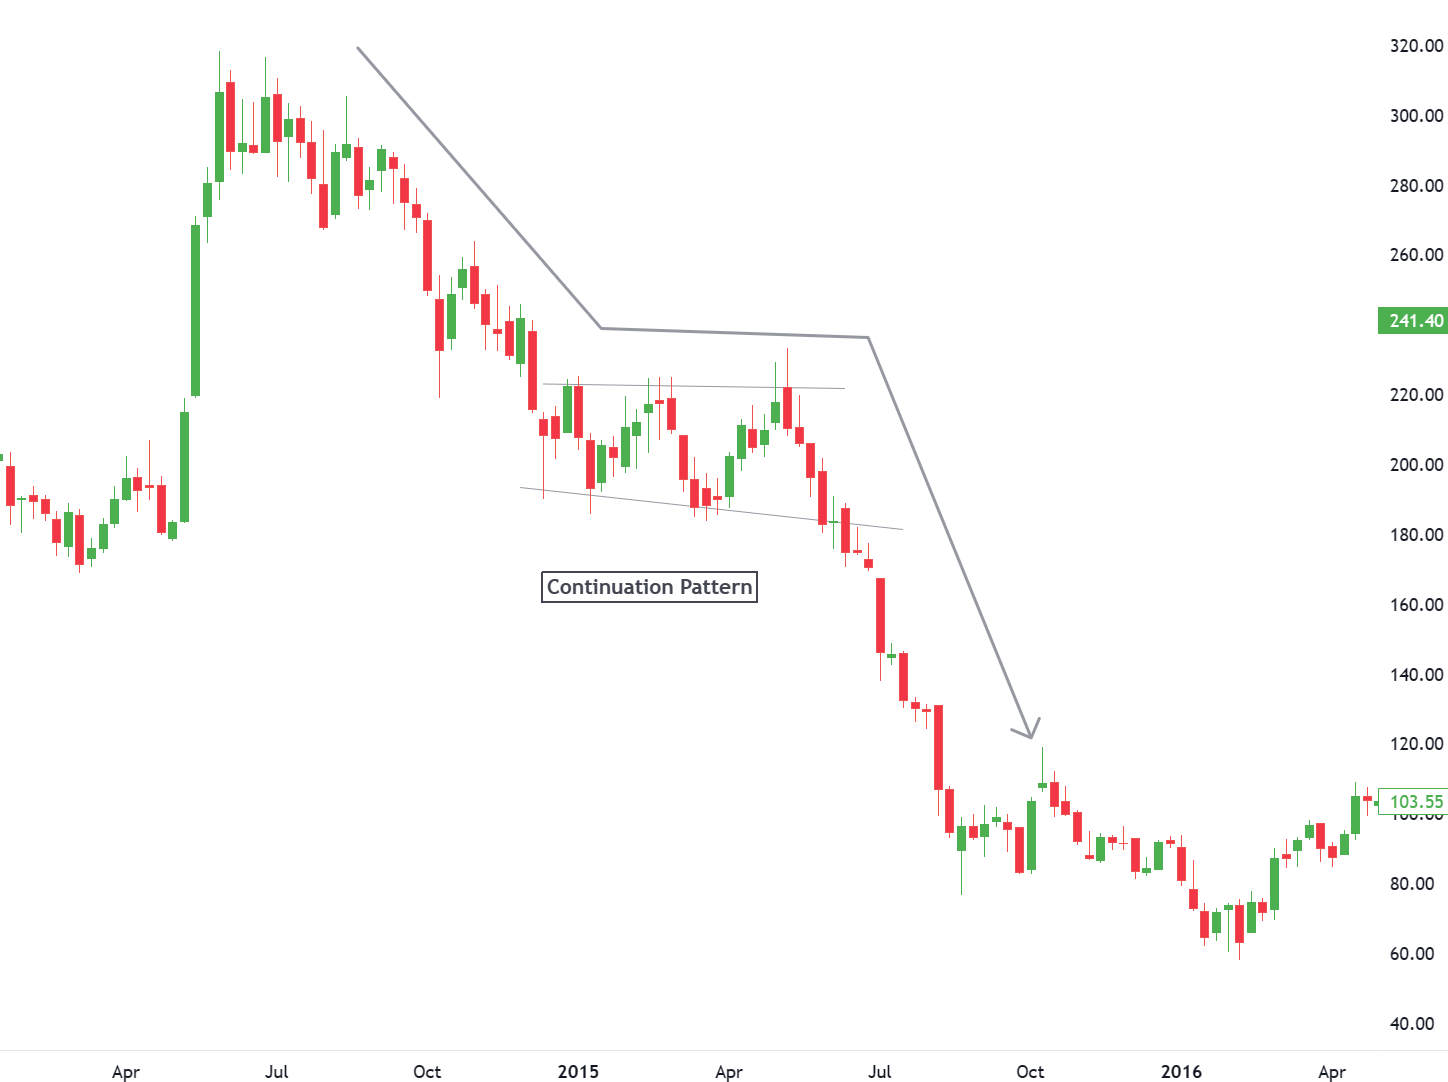
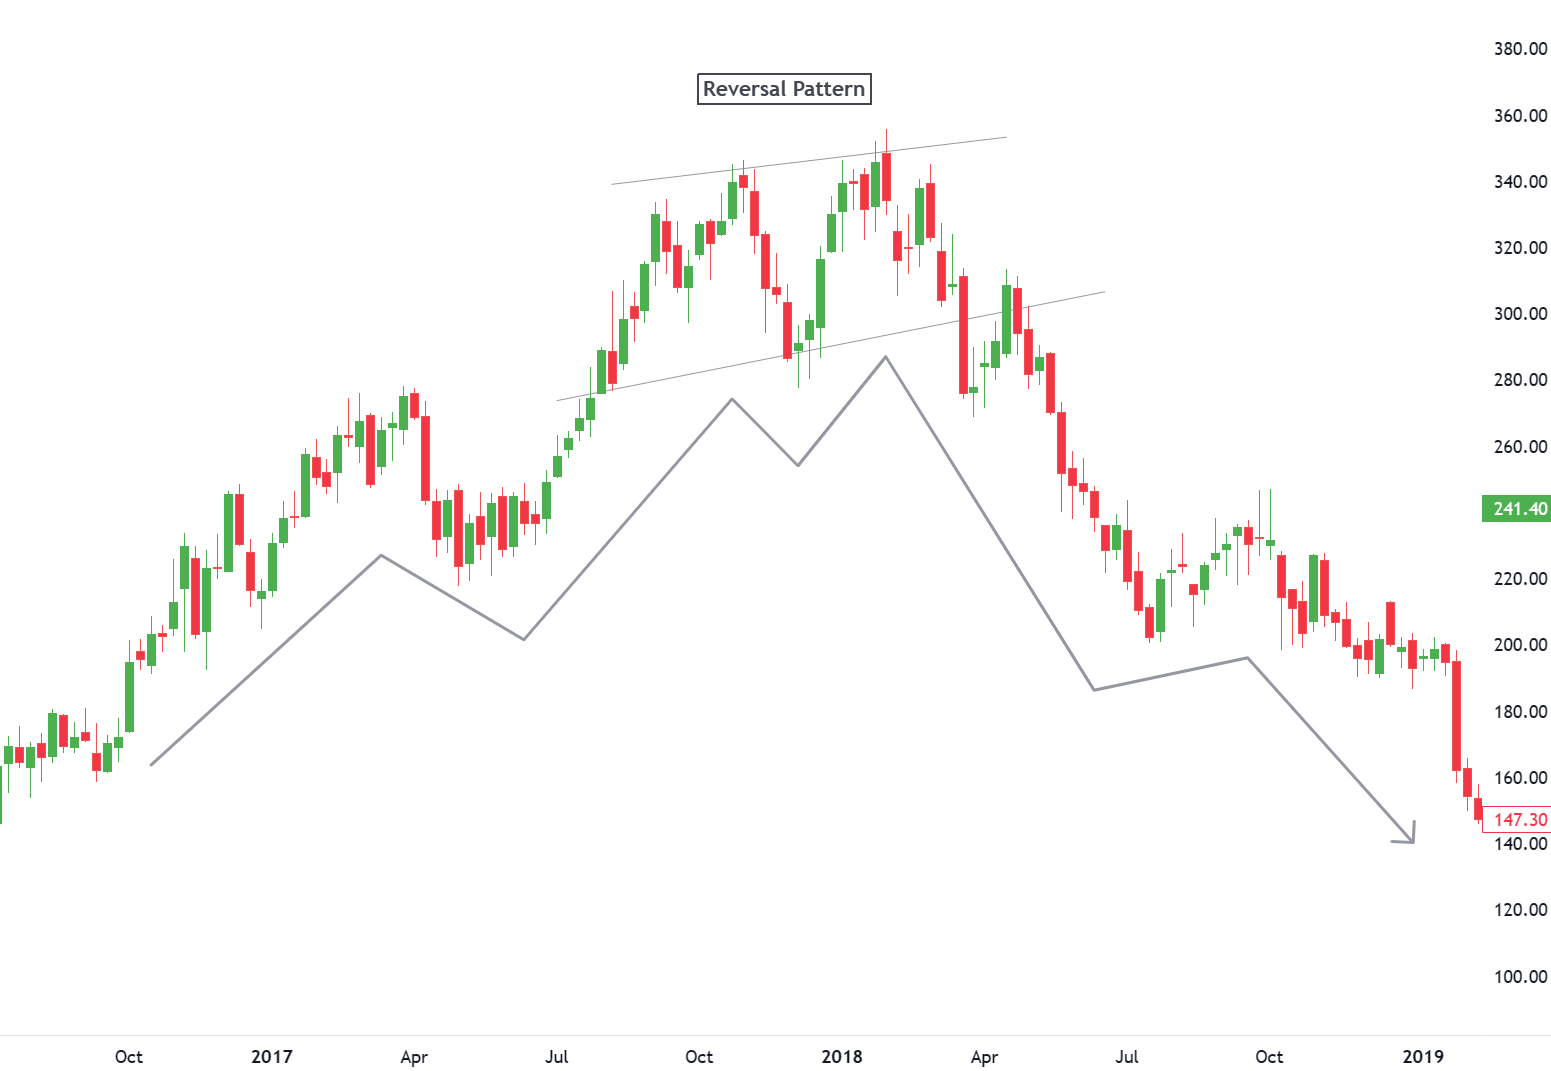
There are tons of chart patterns. Most can be divided into two broad categories—reversal and continuation patterns. Reversal patterns indicate a trend change, whereas continuation patterns indicate the price trend will continue after a brief consolidation.

Comparison

Continuation vs. Reversal Patterns

Two basic principles of technical analysis are that prices trend and that history repeats itself. 

An uptrend indicates that the forces of demand (bulls) are in control, while a downtrend indicates that the forces of supply (bears) are in control. 

However, prices do not trend forever and as the balance of power shifts, a chart pattern begins to emerge. 

Certain patterns, such as a parallel channel, denote a strong trend. However, the vast majority of chart patterns fall into two main groups: reversal and continuation.

Reversal patterns indicate a change of trend and can be broken down into top and bottom formations. Continuation patterns indicate a pause in trend and indicate that the previous direction will resume after a period of time.

Just because a pattern forms after a significant advance or decline does not mean it is a reversal pattern. Many patterns, such as a rectangle, can be classified as either reversal or continuation.

Much depends on the previous price action, volume, and other indicators as the pattern evolves. This is where the science of technical analysis becomes the art of technical analysis.

Steps to Apply

Investing Using Trend

Analyzing chart patterns and understanding how specific securities react to price patterns can help you determine whether the bulls or bears are in control.

This, in turn, can help you strategize your trades by identifying entry points, exit points, and stops.

Sometimes a chart pattern may fail to do what you expect. Other times you may have to exercise patience in waiting for a specific pattern to develop.

Chart patterns are subjective and can be misinterpreted. Because of these caveats, you must practice looking at chart patterns by viewing charts of longer timeframes.

Get PRO

Get access to exclusive premium features and benefits. Subscribe a PRO plan.

Related Topics