When identifying potential price patterns on a chart, it is crucial to try and verify that the market psychology behind the price pattern is really happening at that point on the chart. One of the best ways to do that is to use volume to confirm things.
Learning Tip
Volume is one of the two fundamental data which drives technical analysis. It is extremely powerful indicator when used in conjunction with price. So always make sure to include in your trading strategy.
Use of Volume
Using with Price Patterns
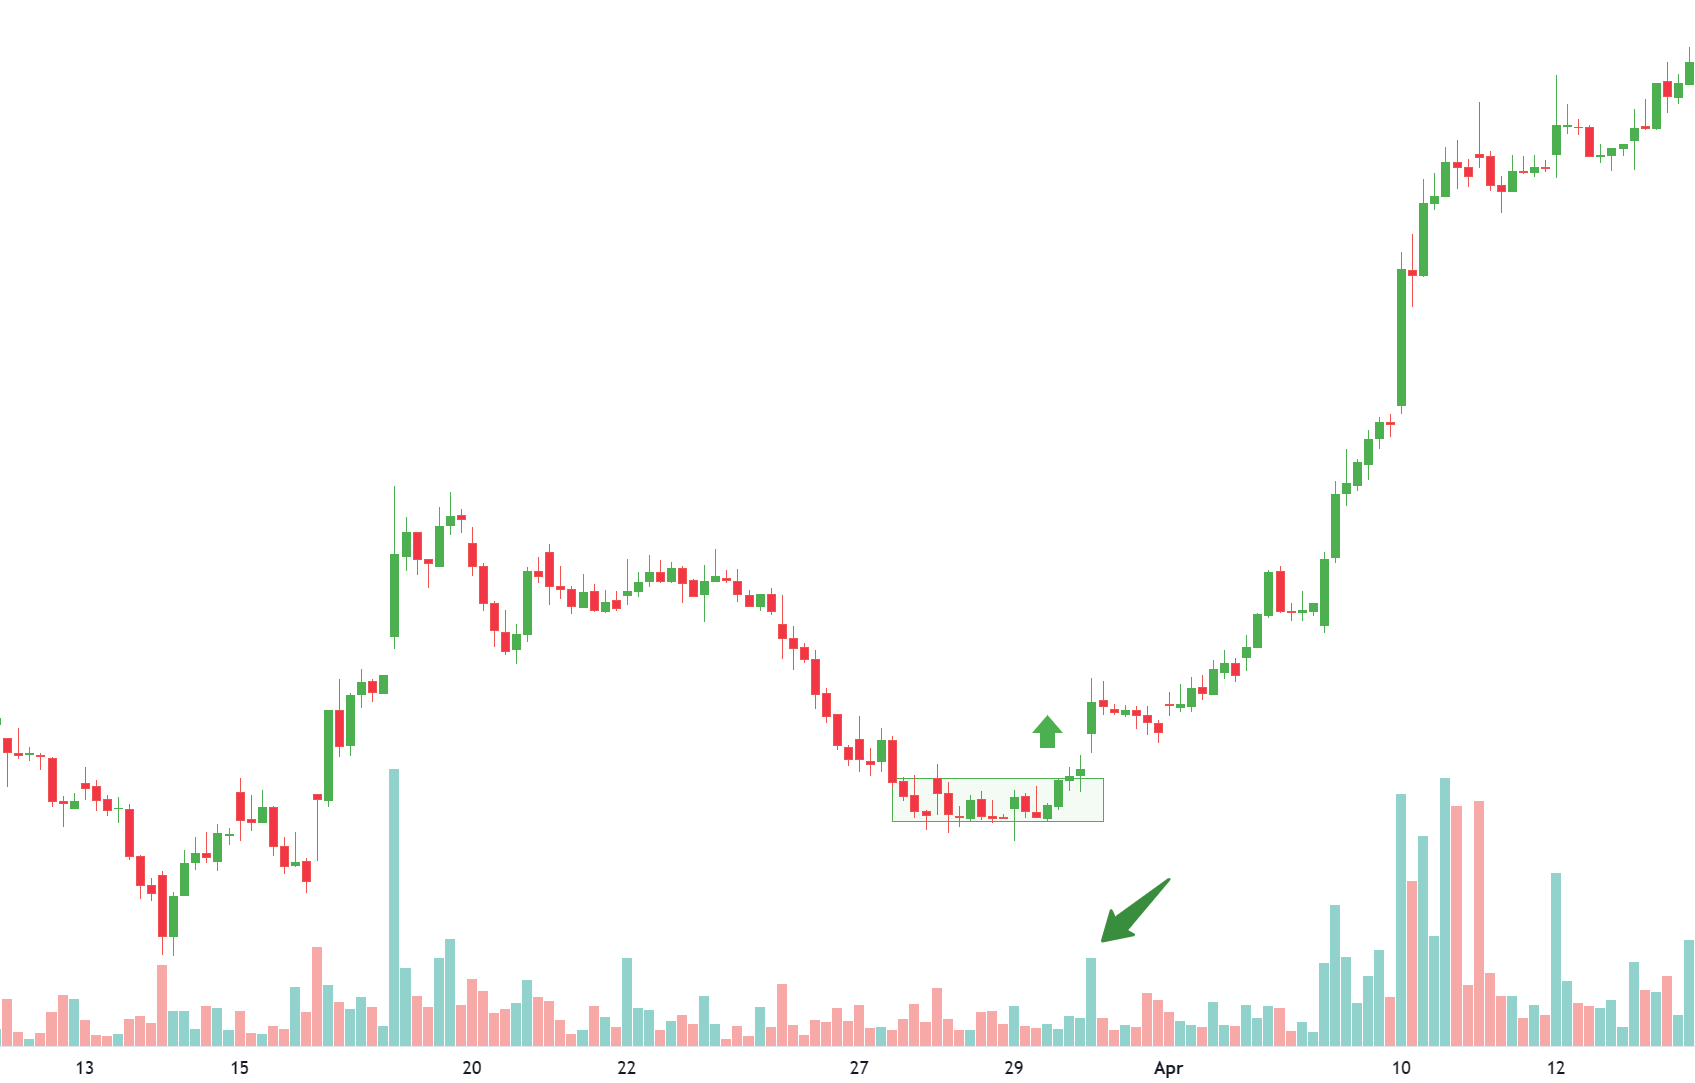
In the case of a rectangle pattern, volume should be decreasing while the rectangle is forming. There may be volume spikes whenever prices get near the top or bottom of the pattern, but in general, as a rectangle pattern continues to develop, volume should decrease. Volume will probably spike up heavily immediately after the breakout as people realize that the support or resistance line has been broken.
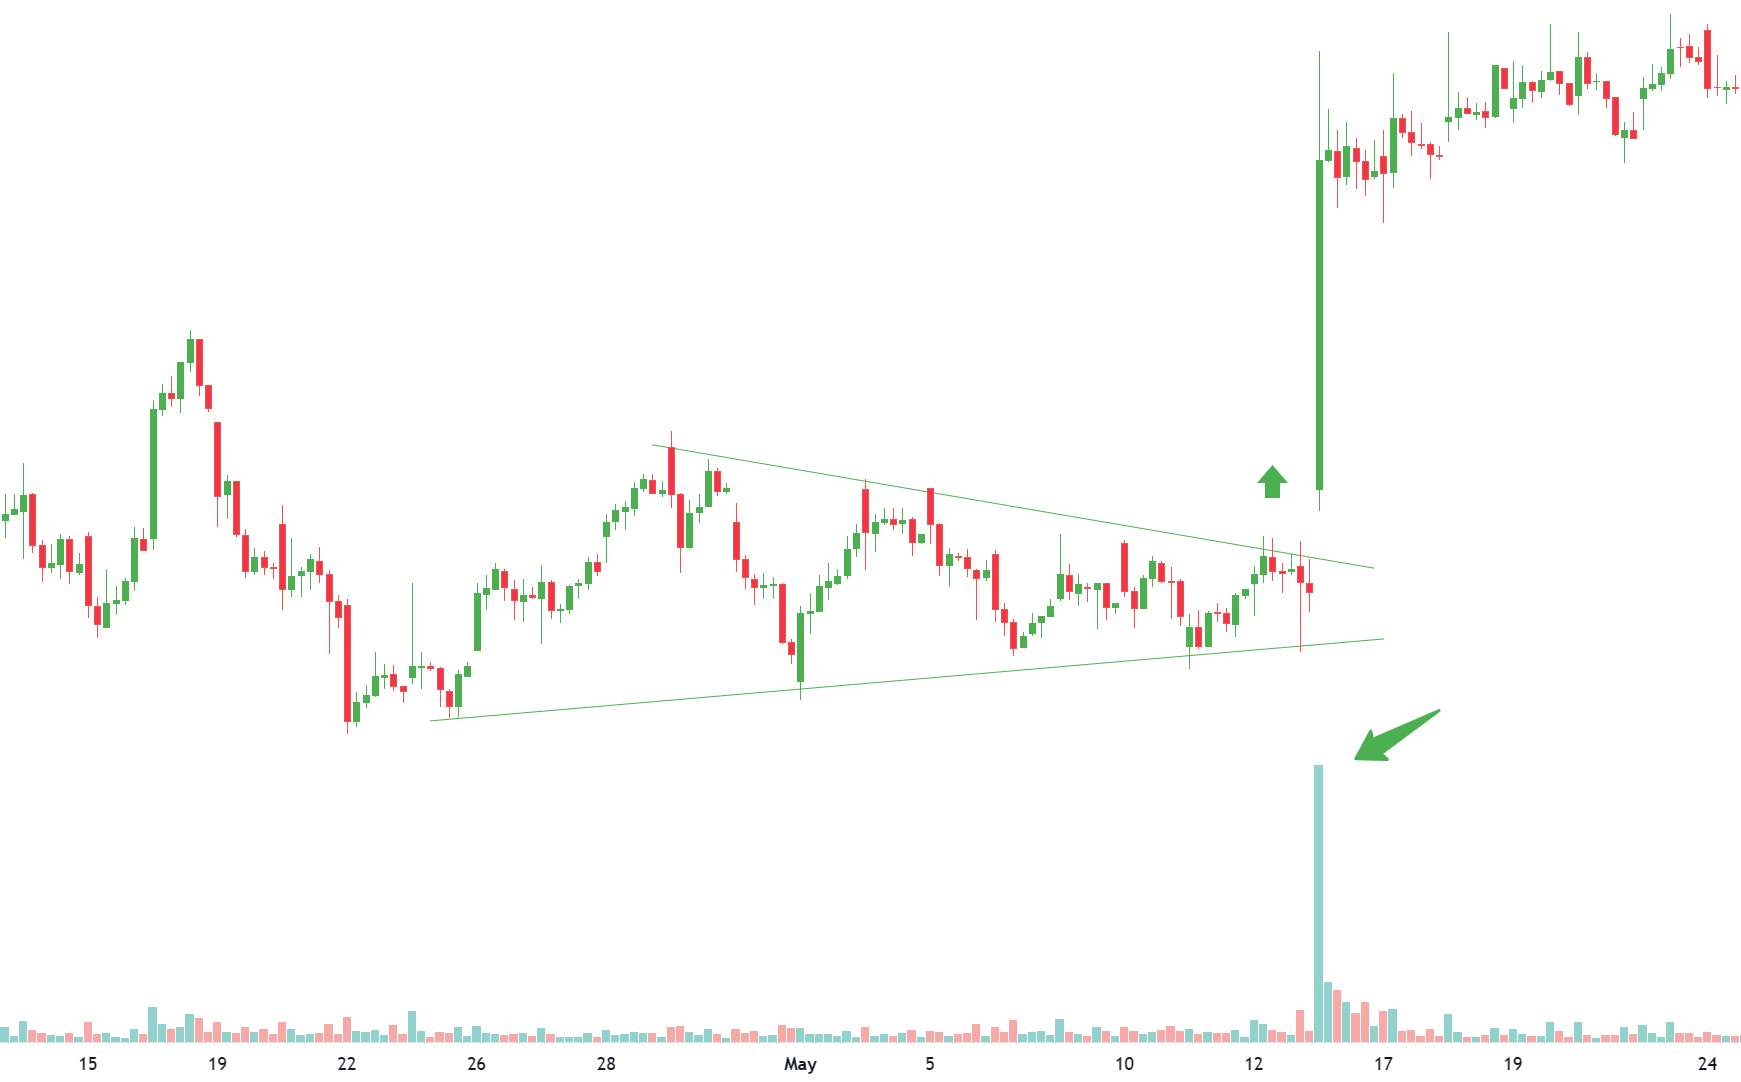
Triangle patterns should have a similar volume pattern – decreasing volume while the triangle is forming with a sharp increase in volume once a breakout is achieved.
Use of Volume
Using Volume to Confirm Trend
In an uptrend, volume should expand as the prices move higher and contract as the prices pull back. As long as this pattern continues, volume is confirming the uptrend. The opposite is true for downtrends. Volume should expand as prices decline and contract during rallies to confirm a downtrend.
Negative divergences can occur if new price highs in an uptrend take place on declining volume. This type of volume activity is an indication of diminishing buying pressure. If the volume also begins to pick up on price pull backs, prices may begin consolidating or reversing into a downtrend.
The same concept is true for positive divergences in downtrends. If volume begins to contract on new price lows but expands during rallies, prices may begin consolidating or reversing into an uptrend.
Conclusion
Important Points
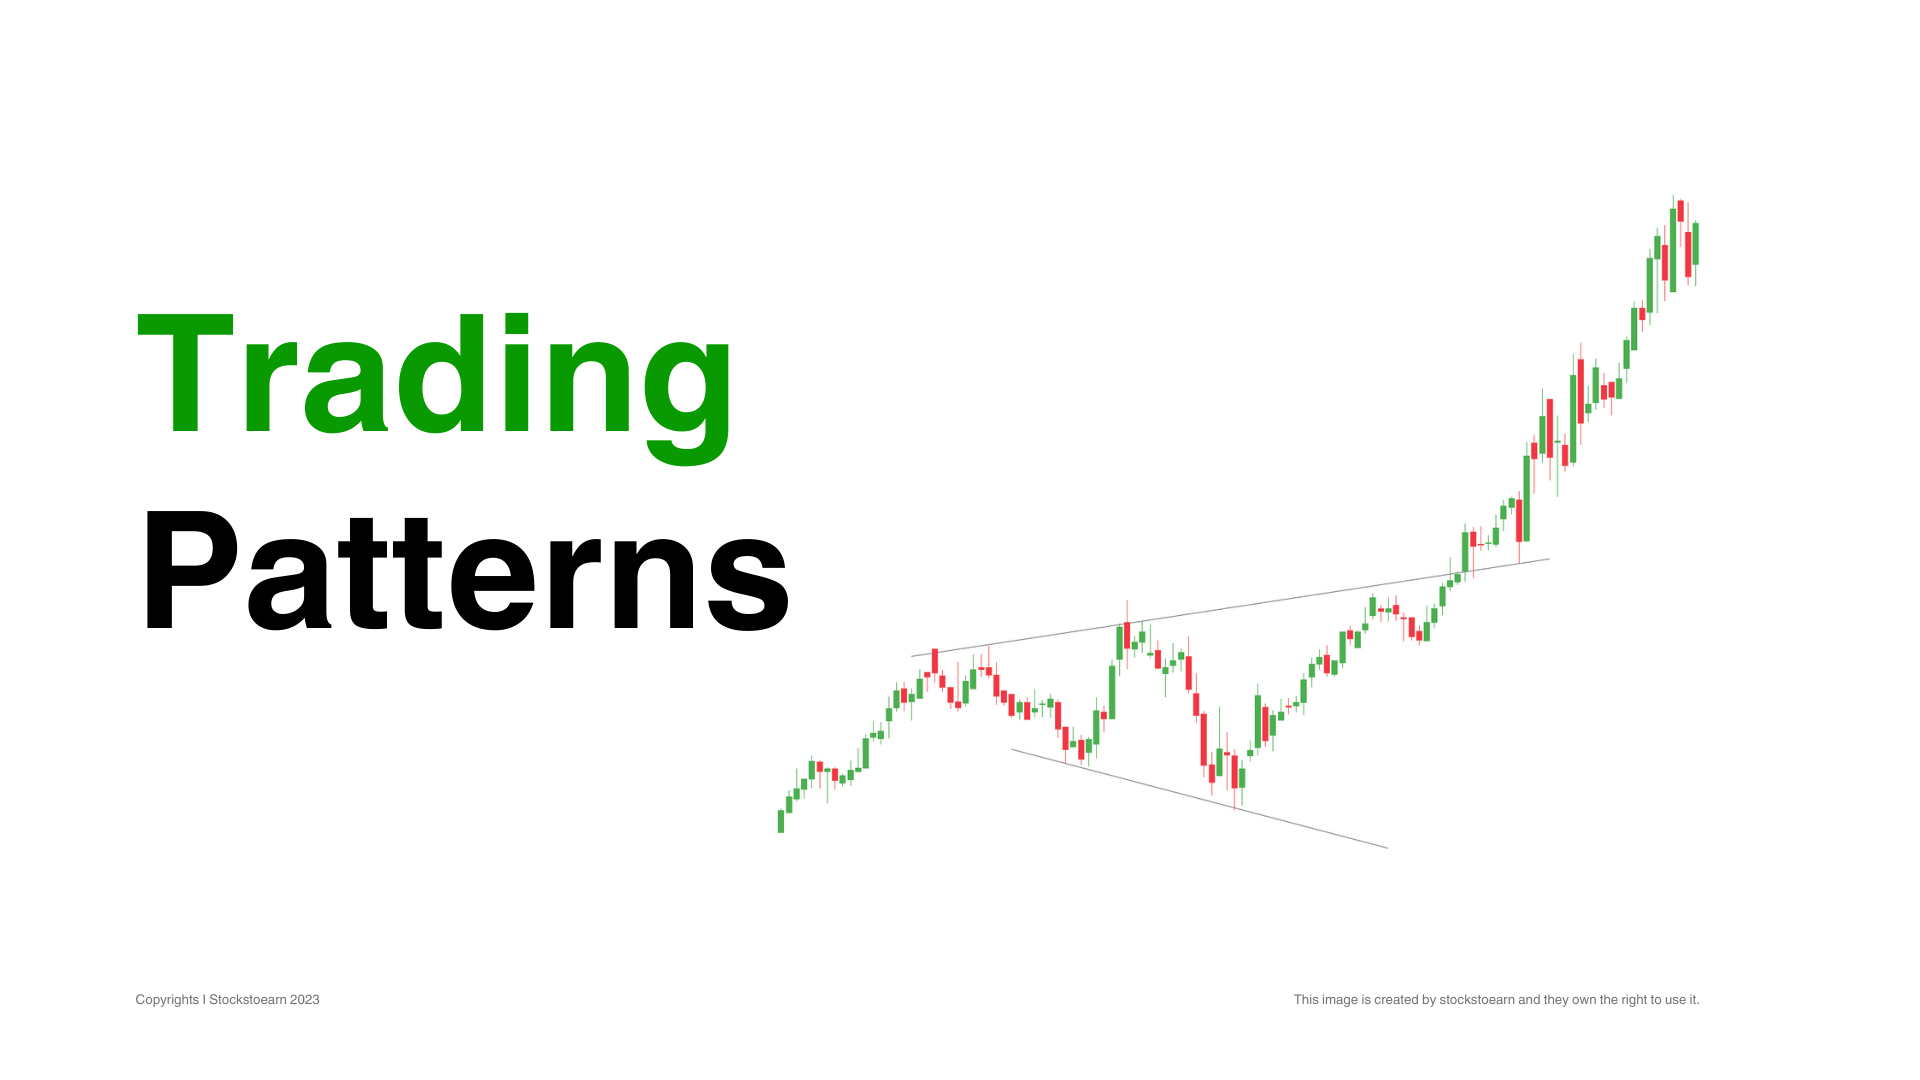
The two price patterns we’ve looked at – Rectangles and Triangles – are examples of Consolidation Patterns, also known as Continuation Patterns. They are called that because, in general, after the pattern completes, prices will usually continue whatever trend they were in prior to the pattern forming.
In order words, if prices are in an uptrend prior to a rectangle pattern forming, prices will usually resume the uptrend once the rectangle pattern finishes. Basically, consolidation patterns are places where the bulls and the bears have another short-term argument about the stock, but it is a half-hearted one. The bigger picture doesn’t really change.