Fibonacci Retracement

Trading Series I Education Hub

Fibonacci retracement levels are based on ratios used to identify potential reversal points on a price chart. These ratios are found in the Fibonacci sequence. The most popular Fibonacci retracements are 61.8% and 38.2%. Note that 38.2% is often rounded to 38%, and 61.8 is rounded to 62%.

Learning Tip

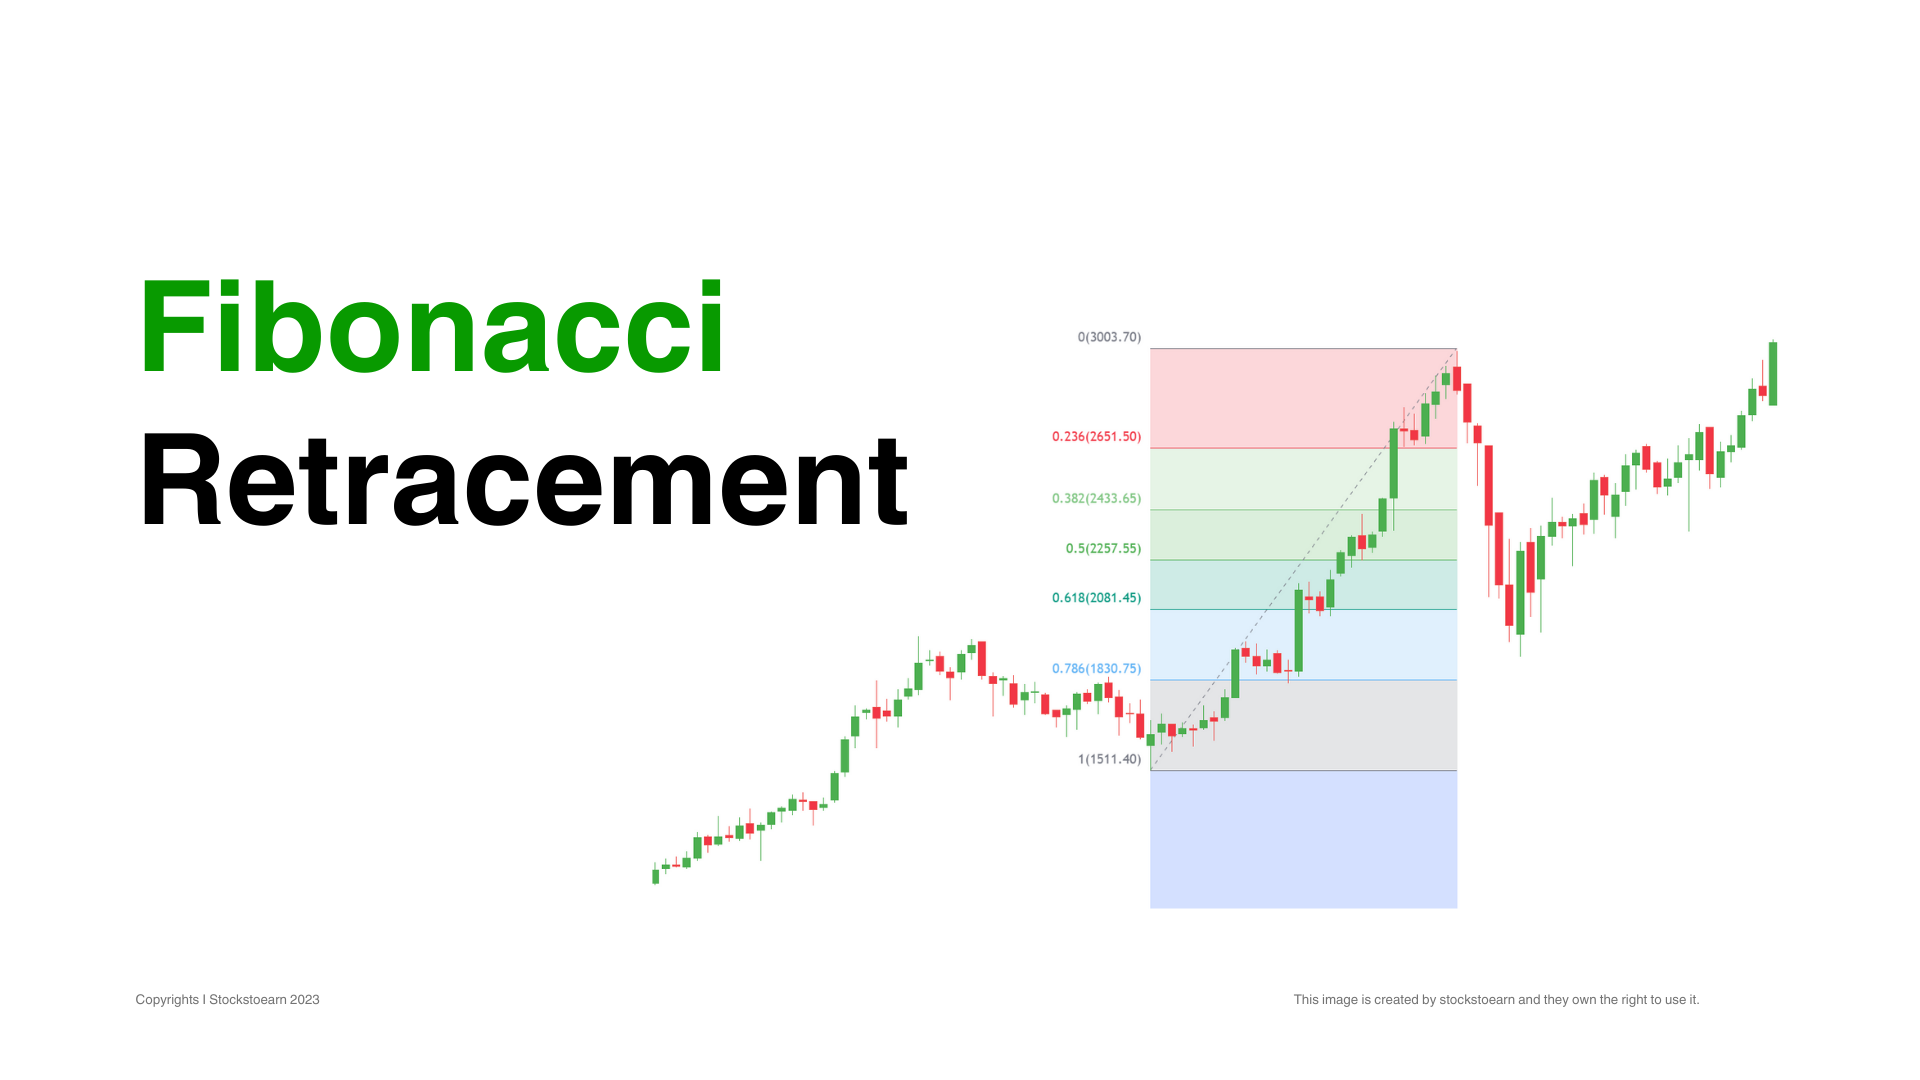
After an advance, chartists apply Fibonacci ratios to define retracement levels and forecast the extent of a correction or pullback. Fibonacci retracement levels can also be applied after a decline to forecast the length of a counter-trend bounce. These retracements can be combined with other indicators and price patterns to create an overall strategy.

Crucial Levels

Fibonacci Levels as Alert Zones

Retracement levels alert traders or investors of a potential trend reversal, resistance area or support area. Retracements are based on the prior move. A bounce is expected to retrace a portion of the prior decline, while a correction is expected to retrace a portion of the prior advance.

Once a pullback starts, chartists can identify specific Fibonacci retracement levels for monitoring. As the correction approaches these retracements, chartists should become more alert for a potential bullish reversal.

Fibonacci Retracement Example

Keep in mind that these retracement levels are not hard reversal points. Instead, they serve as alert zones for a potential reversal. It is at this point that traders should employ other aspects of technical analysis to identify or confirm a reversal. These may include candlesticks, price patterns, momentum oscillators or moving averages.

Classification

Types of Retracement Levels

The Fibonacci Retracements shows four common retracements: 23.6%, 38.2%, 50%, and 61.8%. From the Fibonacci section above, it is clear that 23.6%, 38.2%, and 61.8% stem from ratios found within the Fibonacci sequence. The 50% retracement is not based on a Fibonacci number. Instead, this number stems from Dow Theory’s assertion that the Averages often retrace half their prior move.

Based on depth, we can consider a 23.6% retracement to be relatively shallow. Such retracements would be appropriate for flags or short pullbacks. Retracements in the 38.2%-50% range would be considered moderate. Even though deeper, the 61.8% retracement can be called golden retracement. It is, after all, based on the Golden Ratio.

Fibonacci retracement levels are often used to identify the end of a correction or a counter-trend bounce. Corrections and countertrend bounces often retrace a portion of the prior move. Fibonacci retracements can be combined with other indicators such as candlesticks, price patterns, momentum oscillators, or moving averages to create a robust trading strategy and confirm potential reversals.

Get PRO

Get access to exclusive premium features and benefits. Subscribe a PRO plan.

Related Topics