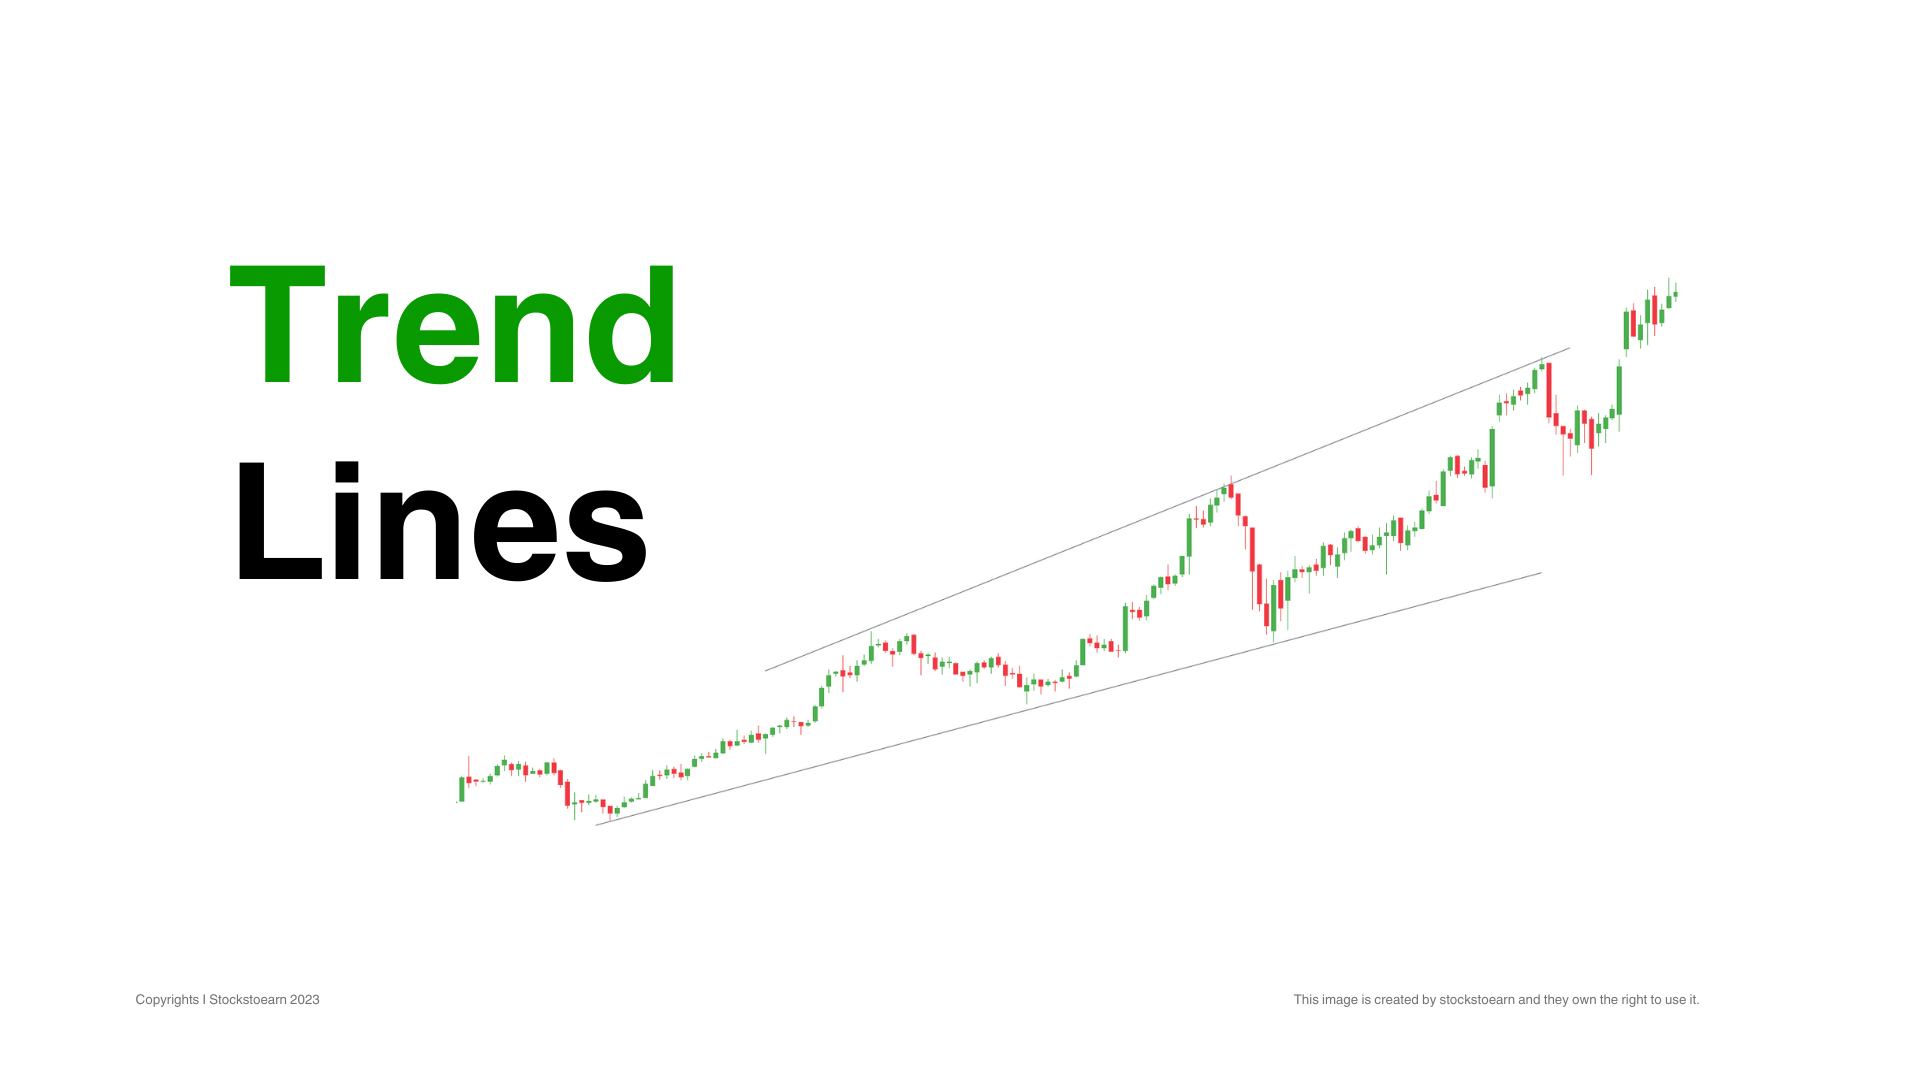
Trading Trend Lines

Trading Series I Education Hub

The psychology of fear and greed of market participants ultimately determines the direction of prices in a market. Prices rise with greed (demand) and fall with fear (supply). A price trend is simply a sustained directional price move. It can be thought of as a tilted support/resistance zone.

Learning Tip

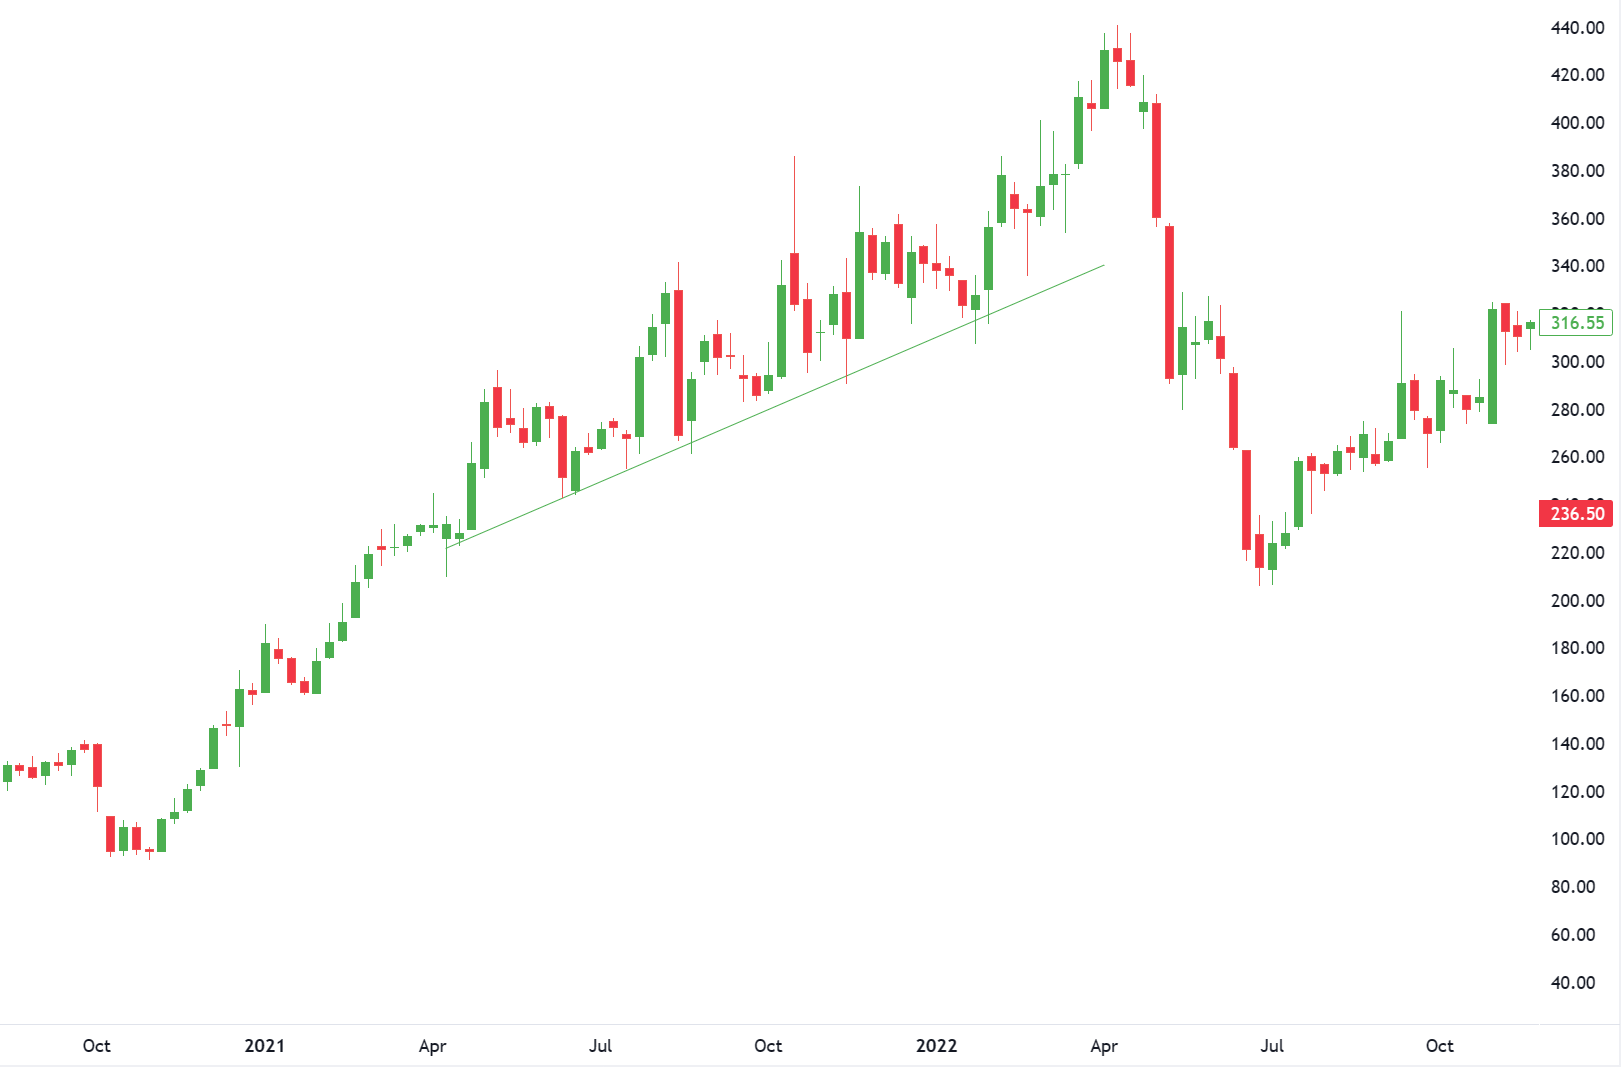
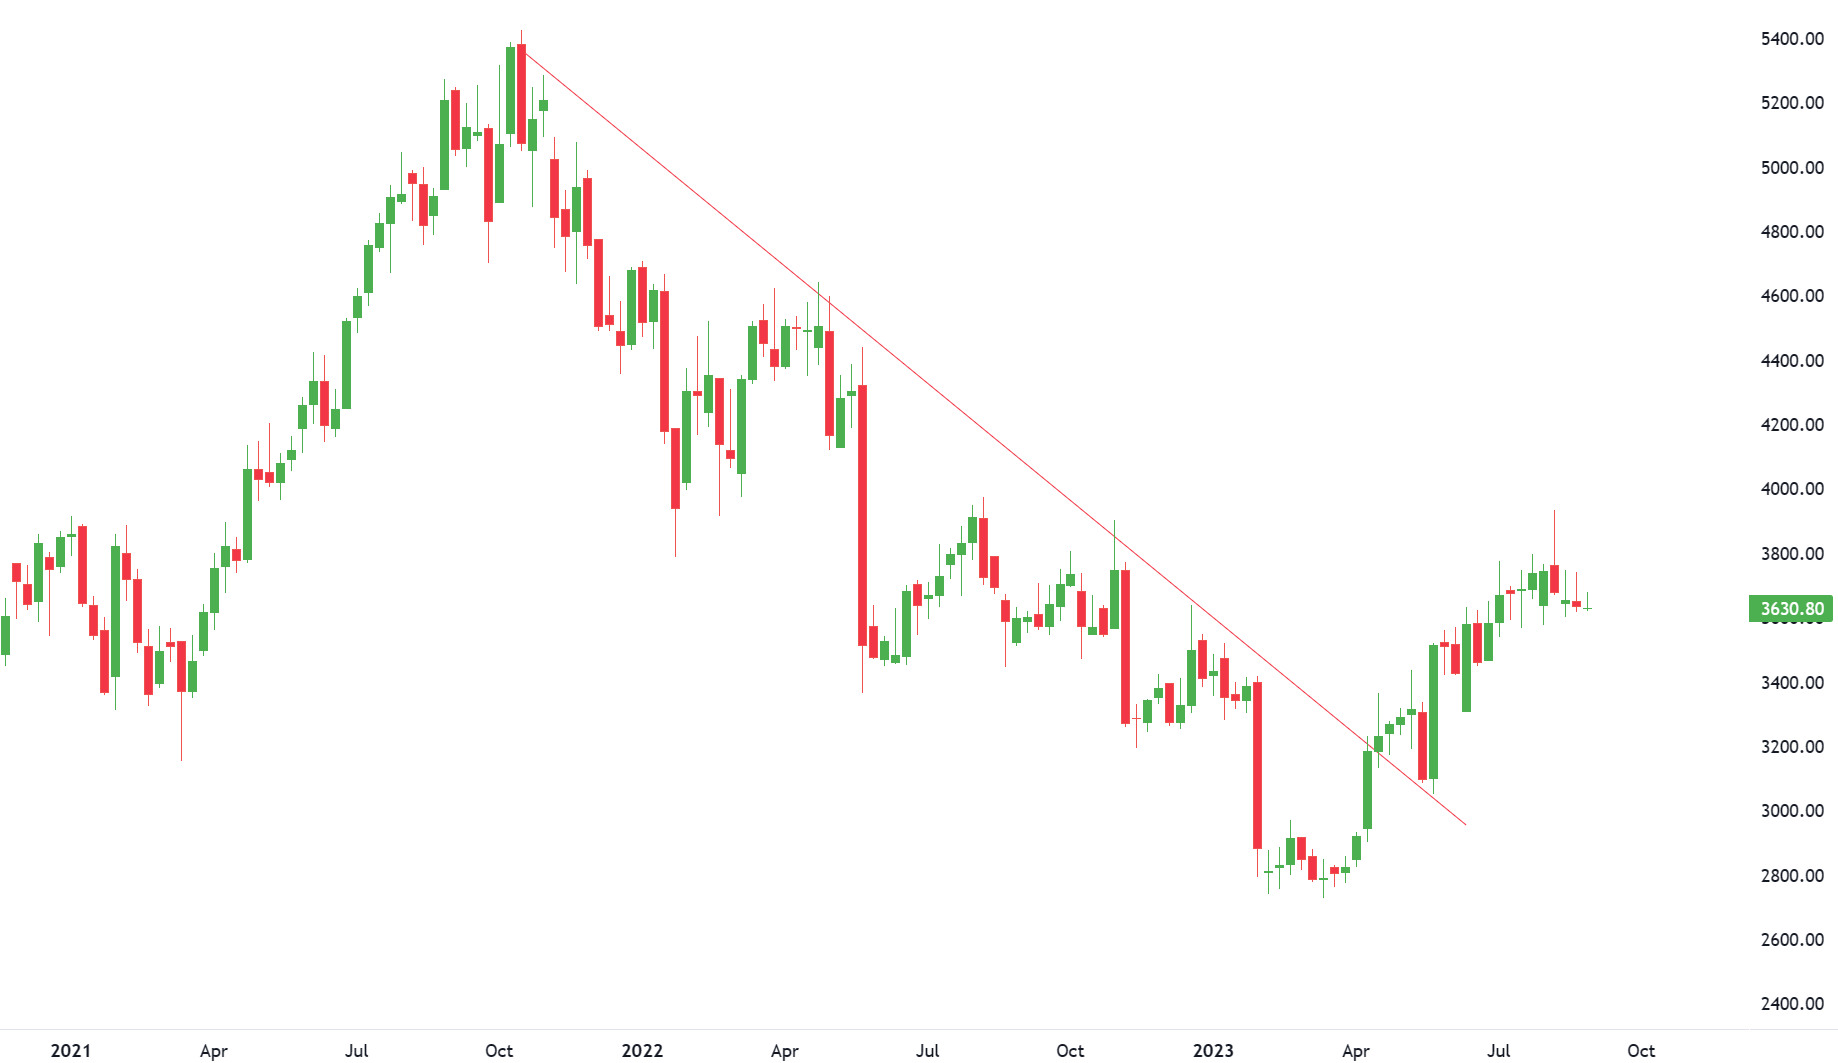
A trend will continue as long as either fear or greed is in control of a market. Trends fade or change direction as the balance of fear and greed changes. The extent of fear and greed in a market can be seen by how quickly prices are trending down or up.

Understanding

Types of Trends

As stated earlier, a trend is a sustained, directional price move. Rising peaks and troughs constitute an uptrend; falling peaks and troughs constitute a downtrend. A trading range is characterized by horizontal peaks and troughs. Trends are generally classified into major (longer than six months), intermediate (one to six months), or minor (less than a month). 

Long term investors are most interested with identifying long-term trends where short-term investors are more interested in minor and intermediate trends. 

Triangle patterns should have a similar volume pattern – decreasing volume while the triangle is forming with a sharp increase in volume once a breakout is achieved.

Understanding

Trend Lines

trend line is a straight line that connects two or more low or high price points and then extends into the future to act as a line of support or resistance. The first two points establish the trend line while additional points validate it.

Up trendline

An uptrend line has a positive slope and is formed by connecting two or more low points. Uptrend lines act as support. As long as prices remain above the trend line, the uptrend is considered intact. A break below the uptrend line indicates that demand has weakened and a change in trend could be imminent.

Downtrend line

downtrend line has a negative slope and is formed by connecting two or more high points. Downtrend lines act as resistance. As long as prices remain below the downtrend line, the downtrend is intact. A break above the downtrend line indicates that supply is decreasing and that a change of trend could be imminent.

Trend line breaks should not be the final arbiter, but should serve merely as a warning that a change in trend may be imminent. By using trend line breaks for warnings, investors and traders can pay closer attention to other confirming signals for a potential change in trend.

Get PRO

Get access to exclusive premium features and benefits. Subscribe a PRO plan.

Related Topics